Maps Overview
Map controls provide rich and interactive visualization of geographcal datasets.
Layers
The Map control can include several map layers. The layers include:
- GeoMapLayer: Displays data in GeoJSON format. GeoJSON is a JSON-based format that describes various geographical features (e.g. countries, provinces, cities, etc.) and can include other non-spatial data related to these features.
- ScatterMapLayer: Displays an array of points defined by geographical coordinates (latitude and longitude).
The data source of map layers can be specified by two ways: set the itemsSource property to data collection or provide a path to data using the url property. When the data source is specified as a url the Map fetches the data and sets it to the itemsSource.
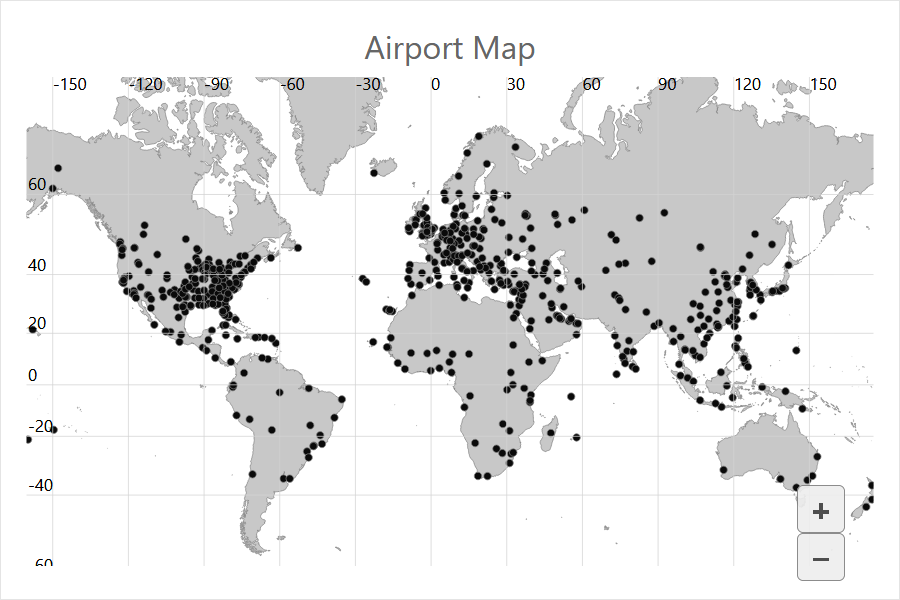
The code below creates a combination of the GeoMapLayer that represents land on the map and the ScatterMapLayer with airport positions.
let map = new FlexMap('#map1', {
    header: 'Airport Map',
    layers: [
        new GeoMapLayer({
            style: { fill: 'rgba(200,200,200,1)' },
            url: 'data/land.json'
        }),
        new ScatterMapLayer({
            style: { fill: 'rgba(10,10,10,1)' },
            url: 'data/airports.json',
            binding: 'coordinates'
        })
    ]
});
Color Scale
One of the most common map visualization tools is a Choropleth map that shows color-encoded geographical data.
The GeoMapLayer and ScatterMapLayer have a colorScale property that, together with the ColorScale class, defines how to calculate the color used for specific geographical features. Suppose we need to color the Map control according to data values contained in the GeoJSON data; the following code uses country color according to its population:
let map = new FlexMap('#map2', {
    header: 'Average Temperature By State',
    layers: [
        new GeoMapLayer({
            url: 'data/US.json',
            colorScale: new ColorScale({
                binding: 'properties.pop_est'
            })
        })
    ]
});
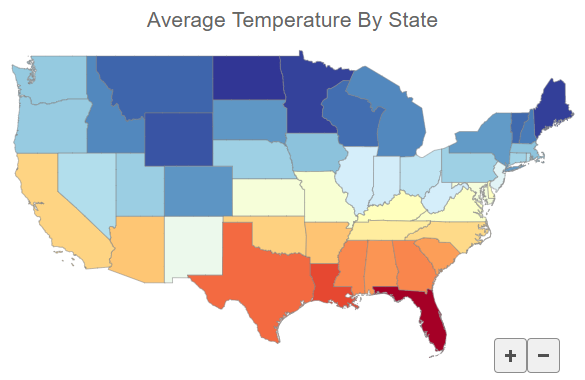
The ColorScale.binding property can also be specified as a function that provides flexible ways to specify color-encoded values. The following code uses 'color' data value from another data source:
let map = new FlexMap('#map3', {
    layers: [
        new GeoMapLayer({
            url: 'data/us.json',
            colorScale: new ColorScale({
                binding: (o) => dataMap.get(o.properties.name),
            })
        })
    ]
});

let dataMap = new Map();
httpRequest('data/temp.json', {
    success: xhr => {
        JSON.parse(xhr.responseText).forEach(el => dataMap.set(el.State, parseFloat(el.AverageTemperature)));
    }
});
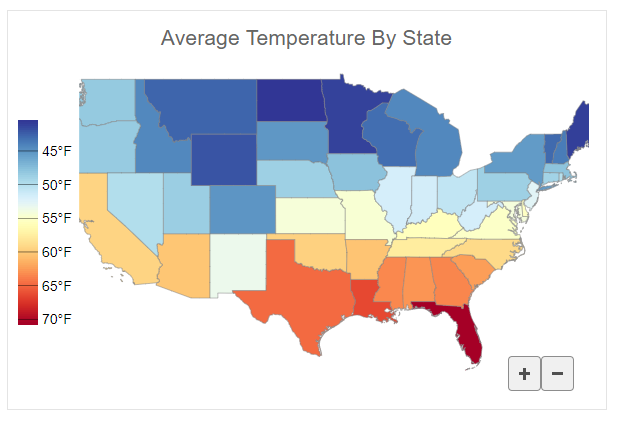
Legend
You can also include a legend for the color scale; you just need to specify a location for the legend element. Use the ColorScale.format property to format the appearance of the legend items. The formatting options are the same as the Globalize.formatnumber() method. For example, the following code shows the legend labels in the millions:
let map = new FlexMap('#map', {
    header: 'Average Temperature By State',
    legend: { position: Position.Left },
    tooltip: { content: (f) => f.name + ' ' + dataMap.get(f.name) + '°F' },
    layers: [
        new GeoMapLayer({
            url: 'data/US.json',
            itemsSourceChanged: (s, a) => { map.zoomTo(s.getGeoBBox()); },
            colorScale: new ColorScale({
                colors: Palettes.Diverging.RdYlBu,
                binding: (o) => dataMap.get(o.properties.name),
                scale: (v) => 1 - v,
                format: 'n0"°F"'
            })
        })
    ]
});