
영역형 도표
영역형 도표는 일정 기간에 걸친 데이터 값의 변화를 추적 및 비교하는 데 적합합니다. 영역형 도표는 기간을 가로로 정렬하고 데이터 값을 점으로 인코딩하고, 선으로 점을 연결하며, 선 아래 영역을 색으로 채웁니다.
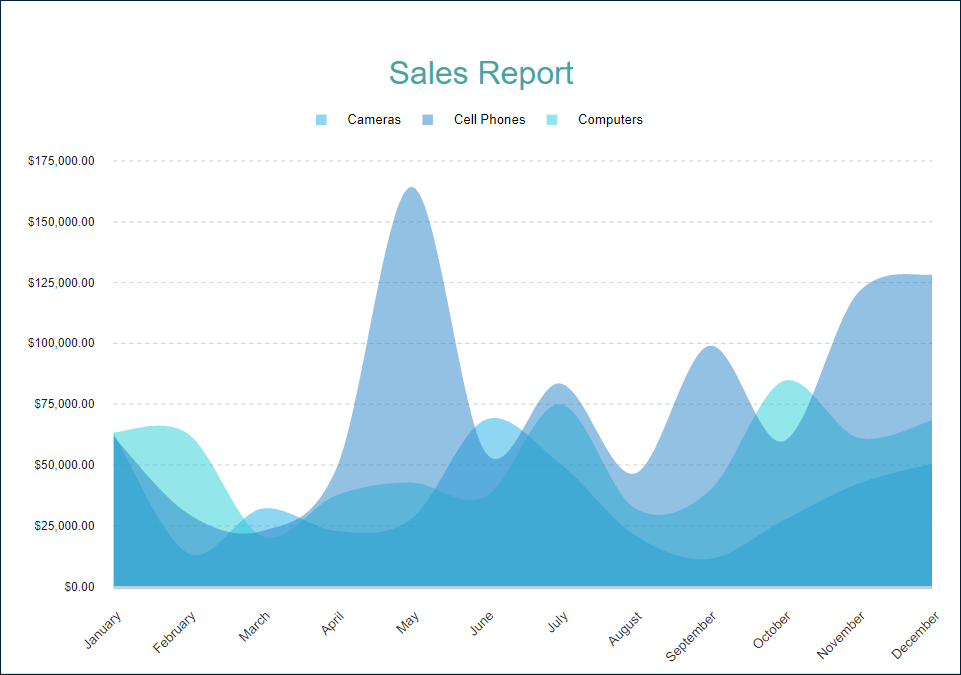
묶은 영역형
묶은 영역형 도표를 사용하면 더욱 세분화된 분석을 위해 데이터 값을 하위 범주로 나눌 수 있습니다. 예를 들어, 묶은 영역형 데모에서는 제품 범주당 일 년에 걸친 순 매출 변화를 묶은 영역형으로 구분해 보여줍니다.
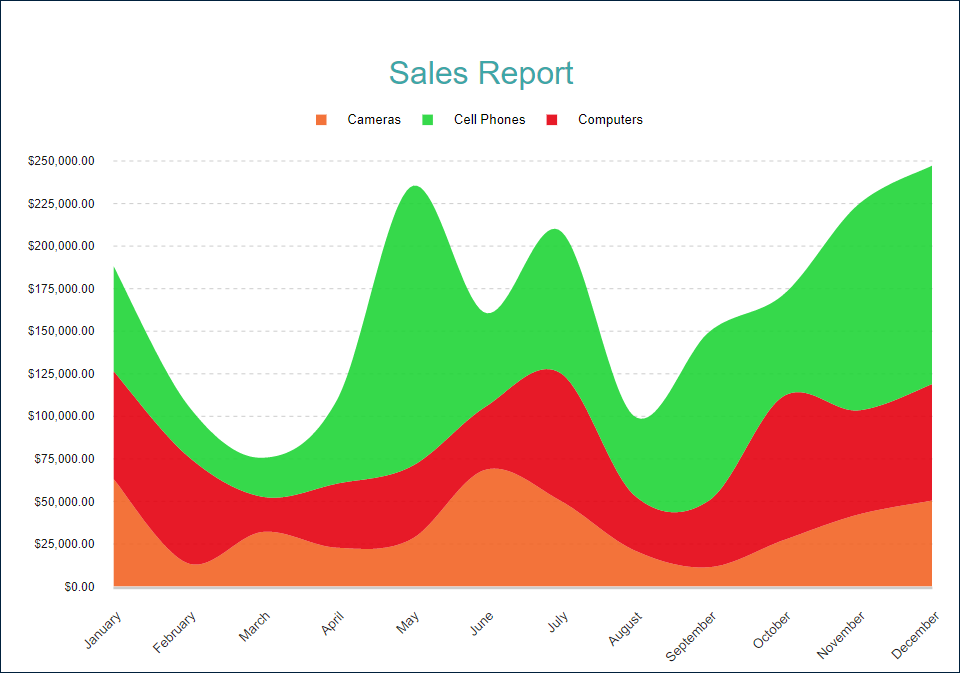
누적 영역형
누적 영역형은 해당하는 영역 하위 섹션을 다른 섹션 위에 배치하여 데이터 값을 하위 범주로 나누는 또 다른 방식입니다. 누적 영역형 데모에서는 제품 범주당 일 년에 걸친 순 매출 변화를 누적 영역형으로 구분해 보여줍니다.
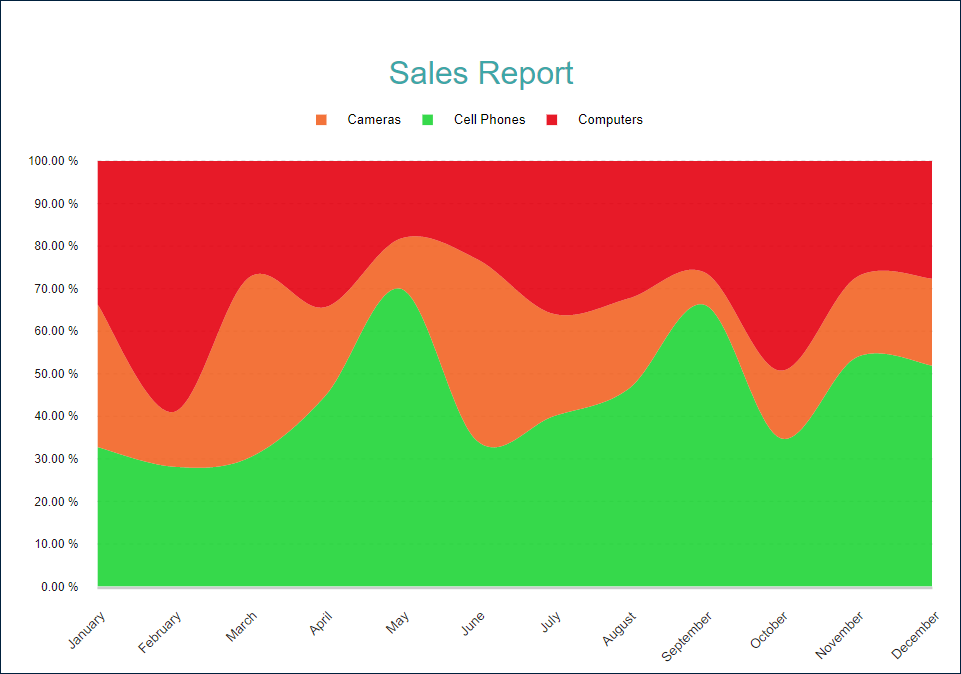
백분율 표시 누적 영역형
백분율 표시 누적 영역형은 누적 영역형과 백분율 표시 축 눈금을 결합합니다. 데이터 값의 변화 외에도 합계에 대한 각 하위 범주의 기여도를 보여줍니다. 예를 들어, 백분율 표시 누적 영역형 데모에서는 순 매출에 대한 제품 범주의 점유율(%)을 보여줍니다.
다음 섹션에서 설명하는 영역형 도표 템플릿과 속성을 사용하여 이러한 모든 유형을 구성할 수 있습니다. 누적 영역형 및 백분율 표시 누적 영역형 템플릿은 특정 구성에 대한 바로 가기입니다.
Range Area
A Range Area plot displays the range or difference between two sets of values across a continuous variable, such as time. For instance, the Range Area Demo displays the confidence intervals of sales forecasts over a year.

Range Area plots can display multiple ranges per category, such as showing sales forecasts for multiple products within a single plot. However, it does not make much sense to display stacked Range Area plots. Stacked plots are generally used to represent a part-to-whole relationship, which doesn't align with the purpose of Range Area plots, which emphasize the range between two data points and the variability within each category.
다음 데모를 사용하여 도표 속성을 살펴보고, 링크를 열고, 보고서 탐색기를 토글하고, Plot - Plot 1 노드를 선택하고, 속성 패널을 사용하여 구성을 수정할 수 있습니다.
아래 나열된 보고서 파일을 다운로드하여 독립 실행형 보고서 디자이너에서 열 수 있습니다.
Chart Wizard
If you add a chart into a report, set the plot type to Area on the first page of the Chart Wizard, and click the Next button, the wizard shows the Area Settings page that looks like the following:

For the Range Area plots, the Chart Wizard settings look slightly different:

The Data Values section allows you to add one or more Data Values.
The Data Categories section allows you to set the Category Encoding.
The Data Subcategories section allows you to configure the Details Encoding.
데이터 값
영역형 도표의 값 컬렉션은 시간에 따라 변화하는 데이터 값을 결정합니다. 컬렉션 항목은 다음 두 가지 속성으로 구성됩니다.
값은 일반적으로 바인딩된 필드 참조입니다. 참고: 이 속성은 컬렉션이지만영역형도표는 첫 번째 항목만 사용합니다.집계는 여러 필드 값을 단일 값으로 줄이는 선택적 함수입니다(예:Count또는Average).
예를 들어 위에 나열된 모든 데모에는 Value={SalesAmount}, Aggregate=Sum 데이터 값이 있습니다.
범주 인코딩
영역형 도표의 범주 인코딩은 도표가 위 데이터 값을 나타내는 연결된 데이터 요소를 생성하는 기간을 결정하는 속성 집합입니다.
범주는 일반적으로 바인딩된 필드 참조입니다. 해당 필드와 값이 동일한 바인딩된 데이터 집합 레코드는 동일한 범주에 속합니다. 고유한 범주가 기간을 형성합니다. 예를 들어, 모든 영역형 도표 데모는 각 데이터 레코드에 대한판매 날짜를 비롯하여 여러 필드를 포함한판매 데이터 집합으로 바인딩됩니다. 이 도표의범주는{MonthName(Month(SalesDate))}식으로 설정됩니다. 따라서 도표는판매 데이터 집합을 거치면서판매 날짜값에서 고유한 월을 찾은 다음 월마다 범주를 하나씩 생성합니다. 데모 출력을 미리 보는 경우 가로 축을 따라 12개월이 정렬되어 있습니다.범주 정렬구성은 범주 값 모양의 순서를 결정합니다. 예를 들어, 데모 도표에는 연도순 정렬을 보장하기 위해범주 정렬 식 = {Month(SalesDate)}, 범주 정렬 방향 = 오름차순설정이 있습니다.
The Chart Wizard offers the simplified editor of the Categories Encoding in the Data Categories section:
A single Category Expression displayed as
Fieldis available.The
Sortingconfiguration of the Category Encoding displays theSort directionproperty only. TheSort Expressionis automatically set to the same value as theFieldproperty has.
세부 정보 인코딩
세부 정보 인코딩을 사용하면 변화를 더욱 세부적으로 분석하기 위해 위 데이터 값을 하위 범주로 나눌 수 있습니다. 영역형 도표의 세부 정보 속성은 하위 범주를 정의하는 항목의 컬렉션입니다. 각 항목에는 다음과 같은 속성이 있습니다.
값은 일반적으로 하나 이상의 바운딩 필드 참조입니다. 해당 필드와 값이 동일한 바인딩된 데이터 집합 레코드는 동일한 하위 범주에 속합니다. 예를 들어, 영역형 데모에서 도표세부 정보값은{ProductCategory}입니다. 따라서순 매출영역은 고유한 제품 범주에 해당하는 여러 하위 섹션으로 나뉩니다.Null 제외플래그는 정의되지 않은세부 정보 값이 있는 데이터 집합 레코드가 시각화에서 제외되어야 함을 나타냅니다.그룹속성은 도표가 영역 하위 섹션을 배열하는 방법을 결정합니다.누적- 도표에서 영역 하위 섹션이 서로 위/아래에 배치됩니다. 이 값을 사용하여누적 영역형도표를 구성할 수 있습니다.클러스터- 영역 하위 섹션이 서로 겹칩니다. 묶은 영역형 데모에서는 도표 세부 정보에 이 값을 사용합니다.없음-클러스터와 동일합니다.
정렬구성은 하위 섹션 모양의 순서를 결정합니다.
The Chart Wizard offers the simplified editor of the Details Encoding in the Data Subcategories section:
A single Details Encoding item is available.
A single
Valueitem displayed asFieldis available.The
Groupproperty of the Detail Encoding is displayed asBreak-down method.The
Sortingconfiguration of the Details Encoding displays theSort directionproperty only. TheSort Expressionis automatically set to theFieldvalue.
색 인코딩
색 인코딩은 세부 정보 인코딩의 색 범례를 활성화하고 색 식과 여러 색 값을 하나의 값으로 줄이는 선택적 색 집계 함수를 포함합니다.
도표는 세부 정보 인코딩으로 생성된 하위 범주에 대해 고유한 색 인코딩 결과를 계산하여 그 결과를 해당 영역의 채우기 색으로 변환하고, 범례에 색과 인코딩 결과 간 일치를 표시합니다. 색은 차트 팔레트에서 가져옵니다.
예를 들어, 영역형 도표 데모에서는 색 인코딩에 {ProductCategory} 식을 사용합니다. 따라서 보고서 출력에는 제품 범주를 해당 영역의 채우기 색상과 일치시키는 색 범례가 표시됩니다.
참고: 색 속성은 컬렉션이지만 영역형 도표는 첫 번째 항목만 사용합니다.
도표의 모양 및 느낌
다음 속성을 사용하면 영역형 도표를 구성하는 셰이프의 모양을 미세하게 조정할 수 있습니다. 영역형 데모의 구성을 수정하여 그 결과를 실제로 확인할 수 있습니다.
불투명도는 색으로 채워지는 영역의 불투명도를 결정하는 숫자(%)입니다. 100%는 불투명한 상태를, 0%는 완전히 투명한 상태를 의미합니다.
선 측면 속성은 데이터 요소를 연결하는 선의 스타일을 결정합니다.
기본은 직선을 의미합니다.스플라인은 베지어 곡선을 의미합니다.단계 가운데,단계 왼쪽,단계 오른쪽은 단계 방향이 다른 단계별 선을 나타냅니다.
Null 표시 속성은 Null 값에 대한 데이터 요소의 배열을 나타냅니다.
간격은 도표가 null 데이터 요소와 그 이전 및 다음 요소 사이에 선을 그리지 않음을 나타냅니다.0은 null 데이터 요소가0값을 가진 것으로 간주됨을 의미합니다.연결됨은 도표가 null 점의 이전 점과 다음 점을 연결합니다.
클리핑 모드는 도표 영역이 도표를 그리는 방식을 나타냅니다.
맞춤값은 도표 영역에서 도표를 맞추기 위해 사용 가능한 모든 공간을 사용해야 함을 의미합니다.자르기값은 도표 영역이 오른쪽 또는 아래쪽 안쪽 여백의 가장자리에서 도표를 절단함을 나타냅니다.없음값은맞춤과 동일합니다.
스타일 섹션의 선 속성은 데이터 요소를 연결하는 선 모양을 결정합니다.
배경 섹션의 색 식은 영역의 채우기 색을 설정하고 앞에서 설명한 색 인코딩을 덮어씁니다.
도구 설명 및 레이블 템플릿
The Text Encoding collection offers a way to configure area plots to display customized labels and tooltips on the data points. Each item within this collection has the following properties:
Values: This is an expression that can reference the values of the bound fields.Aggregate: This optional function, such asCountorAverage, can condense multiple field values into a single value, evaluated within the current detail or category context.Template Key: A string used within the Labels or Tooltip template to represent the text encoding item.Target: This property specifies whether the text encoding item is meant for the plot's labels or tooltips.
Adding items to the Text Encoding collection allows automatic display of configured values in Labels or Tooltips, based on the Target value of each item. To further customize the text of the labels and tooltips, you can employ the Tooltip Template and Label Text Template expressions.
Apart from Text Encoding items referenced by their keys, you can utilize the following pre-defined values:
{valueField.name} :
데이터 값에 바인딩된 필드 이름을 의미합니다.{valueField.value} : 포함 범주 또는 세부 정보 내 현재
데이터 값을 의미합니다.{PercentageDetail} :
세부 정보가 동일한 모든 값 중에서 현재데이터 값의 점유율(%)을 의미합니다.{PercentageCategory} :
범주가 동일한 모든 값 중에서 현재데이터 값의 점유율(%)을 의미합니다.{categoryField.name} : 일반적으로
범주 인코딩에 바인딩된 필드 이름을 의미합니다.{categoryField.value} :현재
범주 인코딩값을 의미합니다.{detailFields.name} : 일반적으로
세부 정보 인코딩에 바인딩된 필드 이름을 의미합니다.{detailFields.value} : 현재
세부 정보 인코딩값을 의미합니다.{colorField.name} : 일반적으로
색 인코딩에 바인딩된 필드 이름을 의미합니다.{colorField.value} : 현재
색 인코딩값을 의미합니다.
These values can be combined and formatted using the interpolation syntax and supported format strings that are also used for the TextBox Report Item.
For example, the plot in the Stacked Area Demo uses an advanced tooltip configuration:
The
Text Encodingcontains theSalesQuantityelement that displays the number of sold items:Aggregate=SumValue={SalesQuantity}Target=TooltipTemplateKey=SalesQuantity
The
Tooltip Templateis configured with the following expression:
{detailFields.value} in {categoryField.value}
Amount: {valueField.value:C2}
Quantity: {SalesQuantity}
레이블 모양
레이블 텍스트 섹션의 텍스트 속성 하위 집합 및 레이블 테두리 섹션의 선 속성을 사용하면 도표 레이블의 해당하는 시각적 매개 변수를 설정할 수 있습니다.
픽셀로 표시되는 레이블 위치 및 선택적 오프셋은 부모 데이터 요소 기호를 기준으로 레이블의 위치를 결정합니다.
내부- 아래쪽외부- 위쪽가운데- 가운데자동-외부와 같음
겹치는 레이블 속성은 겹치는 레이블의 처리를 나타냅니다. 가능한 값은 다음과 같습니다.
자동- 겹침을 방지하기 위해 일부 레이블을 숨깁니다.표시- 계속해서 겹치더라도 모든 레이블을 표시합니다.
레이블 선 섹션의 선 속성을 사용하면 레이블과 부모 데이터 요소 사이에 연결 선을 추가할 수 있습니다. 레이블 선 위치는 레이블의 경계 상자와 선의 연결 점을 결정합니다.
자동- 자동으로 선택됨가운데- 경계 상자측 가운데
작업
이 속성은 보고서 구독자가 채워진 영역의 내부를 클릭할 때 대화형 작업을 결정합니다. 바인딩된 필드 참조를 사용하여 드릴스루 보고서의 매개 변수를 전달하거나 동적 책갈피 또는 URL을 구성할 수 있습니다. 필드 값은 현재 세부 정보의 범위 내에서 평가됩니다. 자세한 내용은 드릴스루 보고서 연습을 참조하십시오. 여기서는 드릴스루 세로 막대형 도표를 설정하는 방법에 대해 설명하지만 동일한 기법을 영역형 도표에도 적용할 수 있습니다.